Floating Production Storage and Offloading (FPSO) used for the oil and gas industry to produce processes and store the oil and gas collected from the sea. The difference between the FPSO and Floating Storage and Offloading (FSO) is FPSO able to produce the oil and gas while the FSO can be used as storage. The size of the FPSO was larger than FCO. Therefore, FCO can play as the role of a tanker.
The reason why FPSO is important to the oil and gas company because FPSO saves the time and cost of the company. For example, can FPSO replace the permanent pipelines and facility and it saves a huge amount from the company. Second, FPSO is safe as it can disconnect immediately if they feel it was not safe. Next, FPSO also convenience and flexibility in which oil and gas companies can rent the vessels, and the asset of the company can be more flexible.
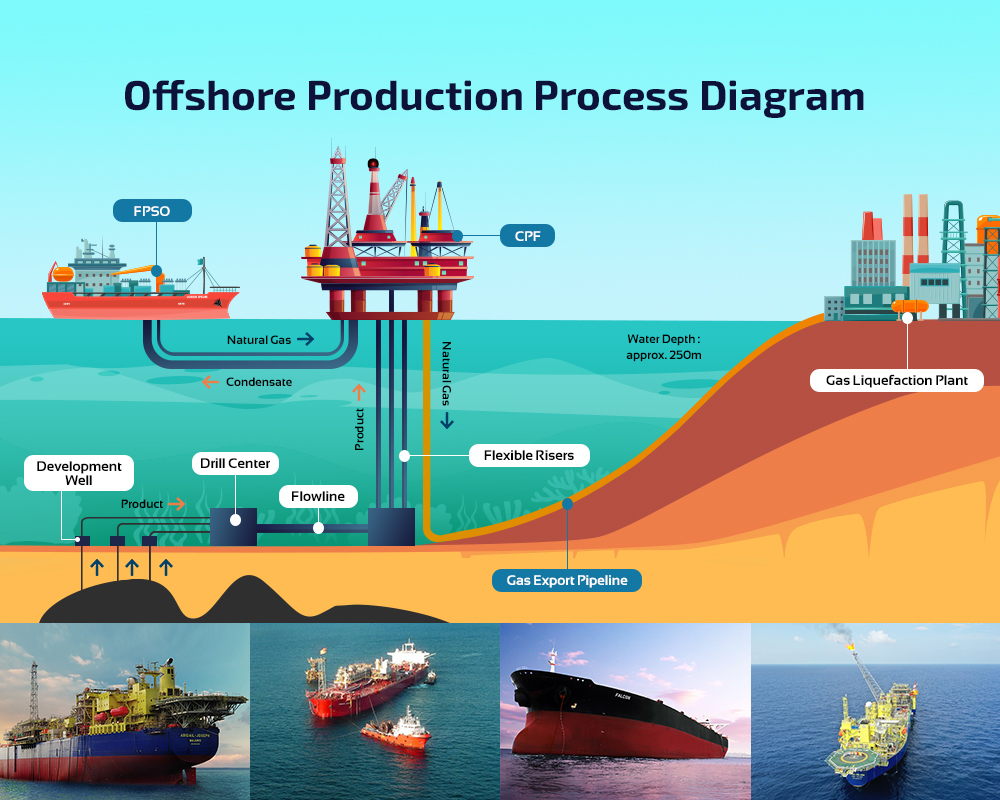
The first running process of FPSO is the production which means that processing the oils and gas that collected from the sea. Using hydrocarbon to separate the oil, gas, and water. The second process is FPSO is storage which stores oil and gas collected from the sea. Last is offshoring which transfers the oil and gas to the other vessel and transfers to the ashore.
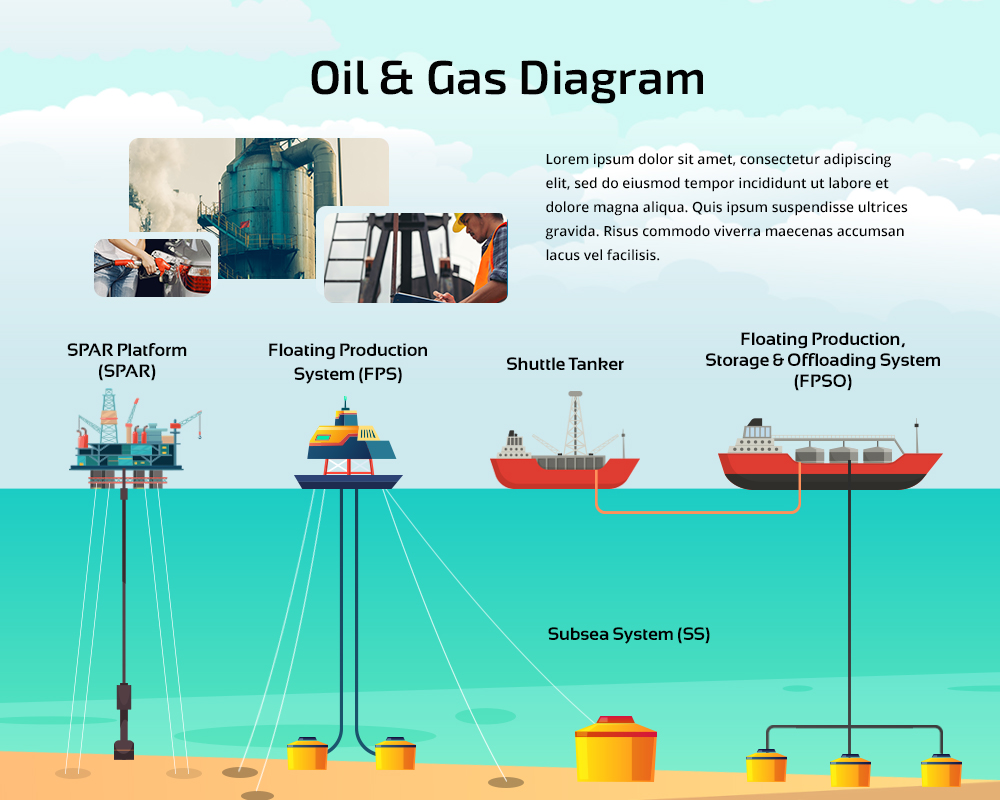
The relevant type of floating storage like FPSO is FSO, Floating Storage and Offloading, Floating, Drilling and Production, Storage and Offloading, and, Floating Storage Regasification Unit. There are 180 units of FPSOs and 100 units of FSO are operating worldwide (Modec, n.d.). 2000 ton of oil will be produce per output to decrease the delivery time as the maximum weight of the crane is 2000 tons (Saeid Mokhatab,John Y. Mak,Jaleel V. Valappil,David A. Wood, 2014).
The top 5 FPSO in the world market is Bumi Armada, BW Offshore, MODEC, Petrobras and SBM Offshore in 2017 to 2021 (Businesswire, 2017). As the combination of Bumi Armada, MISC and Yinson the revenue are increasing from 2010 to 2015 and decrease some revenue in 2016 (Malaysia Petroleum Resources Corporation, 2018). The revenue of 3 organization diagram are shows below.